Home > Listening Therapy > Listening Curve
By measuring and analysing the listening response of great musicians and singers, Tomatis was able to ascertain exactly what constitutes a musical ear. The listening curves illustrated on the following web pages graphically describe the ability to process the various frequencies. These curves show the relation between decibels and frequencies of individual listeners before and after undergoing a course of listening. The ideal listening curve shows a pattern of listening which enables the person to focus on sounds that nourish and charge the body with energy allowing a maximum response to the subtitles of artistic expression and deep connection with oneself and the environment.
Measuring a clients listening response is the first step in a listening course. Further monitoring takes place over the duration of the course.
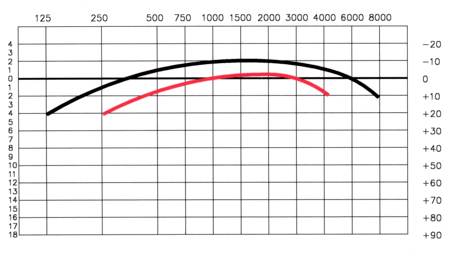
Ideal Listening Curve